


A Picture is Worth 1000 Turds

HUC stands for Hydrologic Unit Code and is part of a hierarchical system we use to classify watersheds. HUCs have numbers ranging from 2 to 12 digits with the biggest watersheds having two digits and the smallest 12. Eight-digit HUCs are a common spatial scale for study and Iowa has 56 of these with an average area of 1000 square miles.
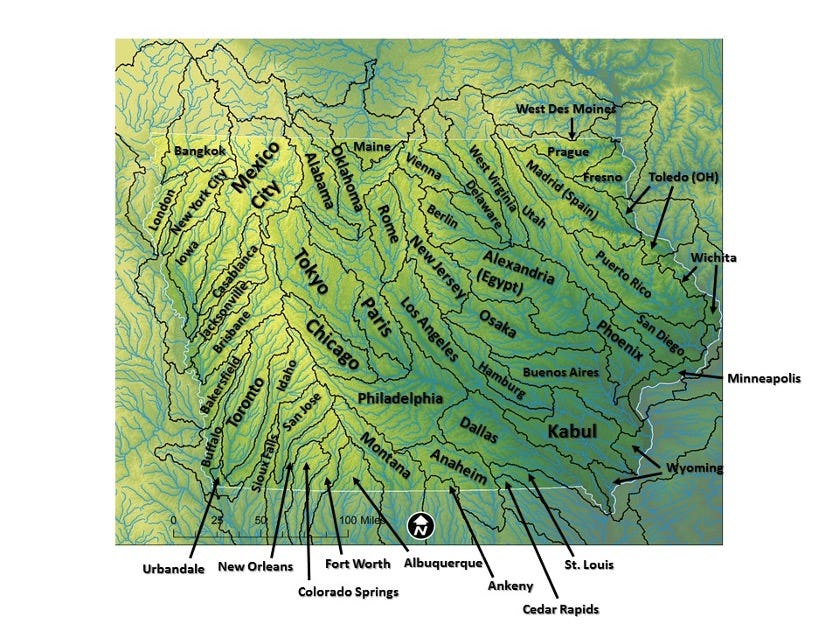
Six years ago I assembled livestock data for Iowa’s HUC 8 watersheds and then quantified the amount of waste excreted by these animals in terms of nitrogen, phosphorus and solids. From that I determined the equivalent human population needed to excrete that same amount of waste and then dropped a place name onto each HUC 8 that was comparable to that human total. For the state as a whole, that human population was 168 million (eq., Bangladesh); Iowa’s actual human population is about 3.2 million.
Everybody in ‘the biz’ could have predicted what such a map would look like, at least in some abstract way. For that reason, I was surprised at how the map rattled general audiences into the realization of how many livestock animals we have in Iowa, and what a colossal task it is to manage their waste. I think it was easy for people to draw a line from that map to unsafe beach postings. Call it the “A Picture is Worth a Thousand Turds” phenomenon.
A few months ago an organization in Michigan, For the Love of Water (FLOW), asked me if I could replicate the exercise for the Great Lakes Basin. I thought so, at least for the US side and this I did. This map is shown below.
FLOW’s mission is to ensure the waters of the Great Lakes Basin are healthy, public, and protected for all.
Largely because almost the entire state drains to the Great Lakes, Michigan produces the most manure waste of the eight states with land area draining to the basin. Illinois produces the least because there’s not a lot of livestock in Chicagoland, which comprises almost all of the Illinois area draining to the basin. And while the Bears may stink, they don’t produce all that much fecal waste. Other areas with little livestock include Minnesota’s North Shore areas draining to Lake Superior and the Upper Peninsula of Michigan.
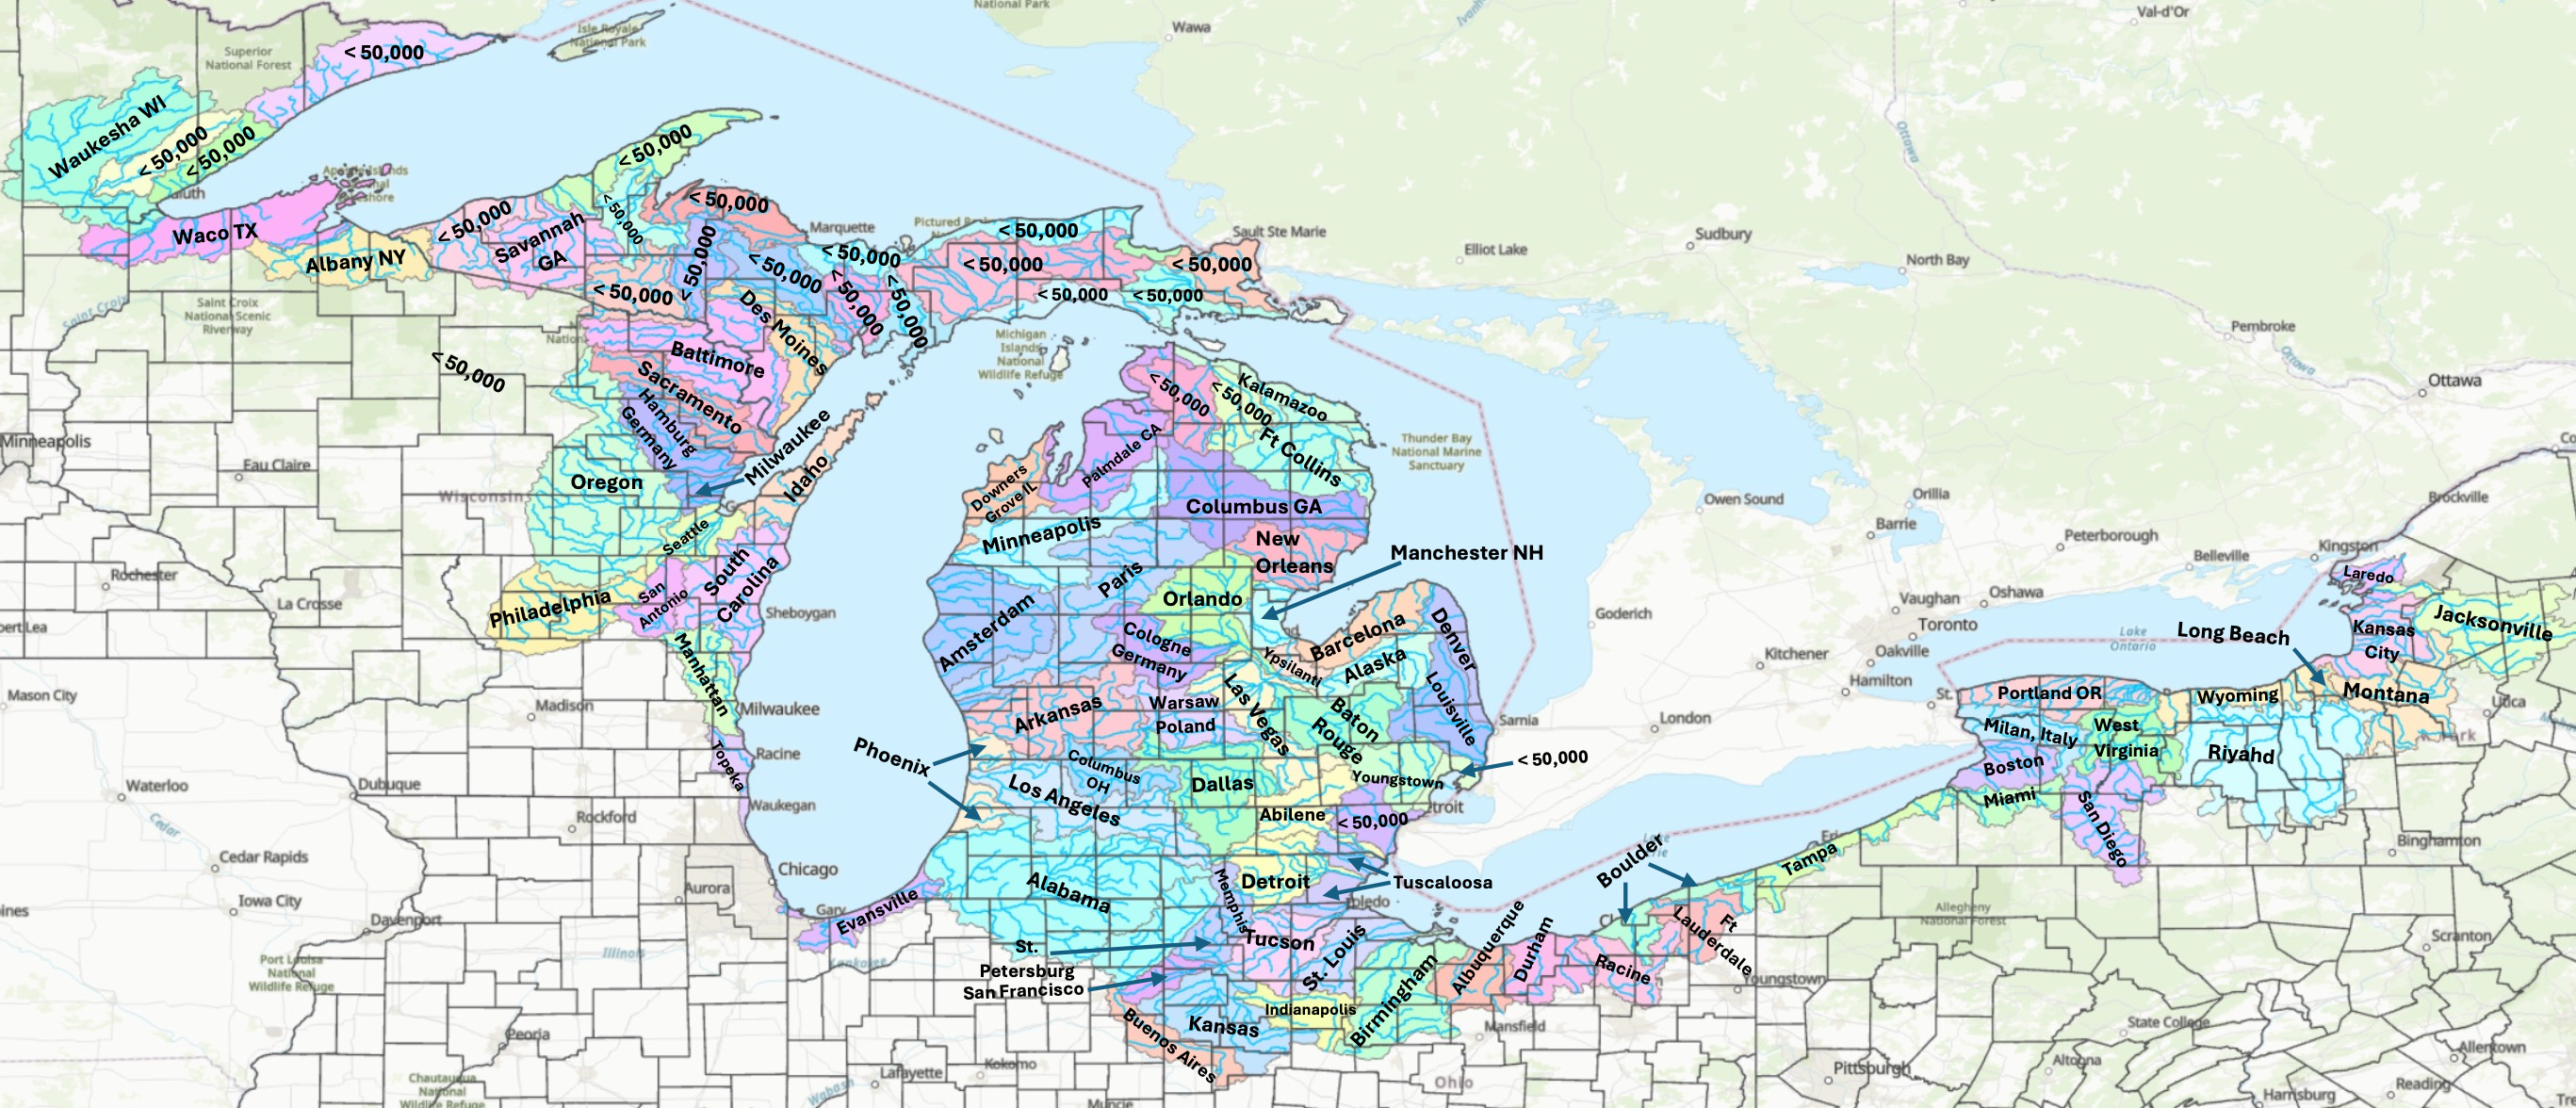
The Great Lakes Basin catchment with the most livestock waste is the Seneca River watershed of New York. Rounding out the top 5 are the Manitowoc-Sheboygan watershed of Wisconsin, the St. Joseph River watershed of Michigan and Indiana, the Wolf River watershed in Wisconsin, and the Kalamazoo watershed in Michigan.
While the bulk of the manure in Iowa is generated by hogs, dairy and beef cattle waste dominate in this basin, although there are some very large hog, laying chicken and meat chicken operations in some of the states.
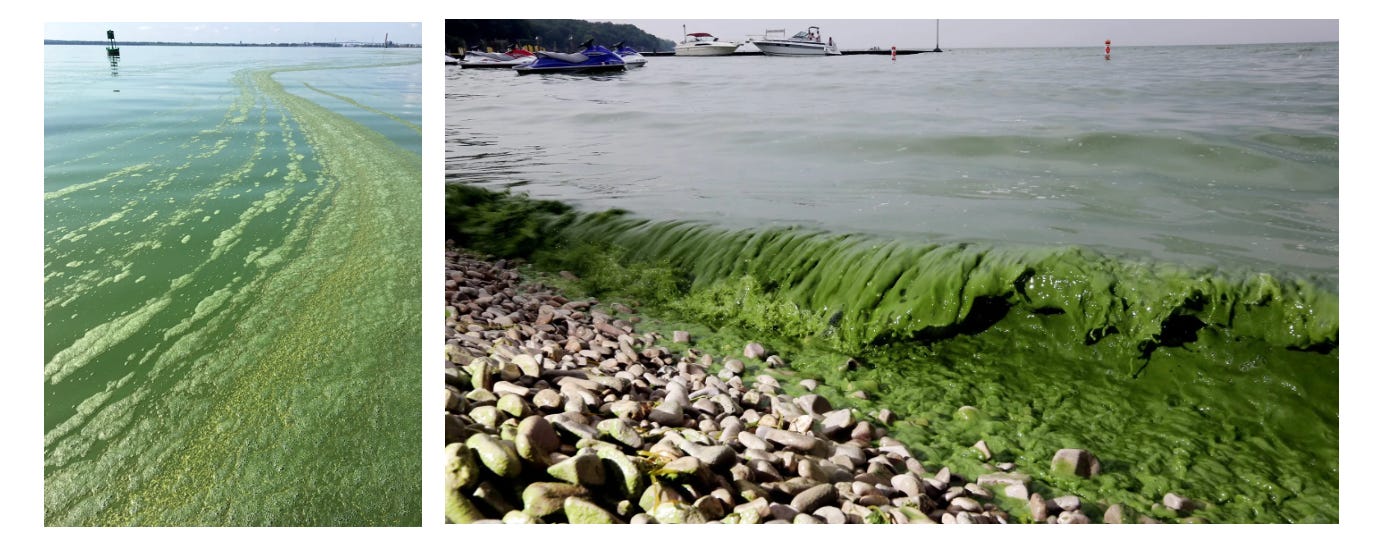
Most of the ag-sourced pollution we hear about in the Great Lakes Basin concerns Western Lake Erie and the Green Bay portion of Lake Michigan. Intense crop and livestock production draining to the shallow and warm waters of these areas make them especially vulnerable to toxic algae blooms and other consequences of eutrophication.
All in all, the fecal waste generated in the US portion of the Great Lakes Basin (119,000 square miles) amounts to that produced by 81,000,000 people, less than half that generated in Iowa from an area of 56,000 square miles. In other words, 4 times the livestock fecal waste (per square mile) is generated in Iowa than is generated in the US portion of the Great Lakes Basin.
In aggregating data for this Great Lakes project, I became reacquainted with Census of Agriculture county profiles, created every five years by USDA. Although some of the data is maddeningly ambiguous, they’re still very useful summaries of a county’s land use, livestock and economic data. It’s hard to understate the value of Census of Agriculture data to academic researchers; I doubt that I ever wrote a journal paper without it. For that reason I fear it is the exactly the sort of thing the Trump administration will draw the curtain upon. Hopefully someone somewhere has the entire Census of Agriculture database downloaded; it is a massive and priceless resource.
As I said, some of the data can be ambiguous and this often is by design. Much of the data generated is considered sensitive or proprietary by some, even conservation data that the taxpayer has paid for. Most of this secrecy is unjustified in my view but the magnitude and utility of the USDA database causes most researchers to just live with it, not that there’s any choice.
One place of ambiguity is farm size. Literally everyone in agriculture likes to assert that wherever they are, small ‘family’ farms predominate. You frequently hear ag advocacy organizations say the average Iowa farm is less than 400 acres. Well, yes, when you look at all the farmed acreage in Iowa and divide it by the number of farmers, you get about 360 acres. But this is misleading because the data is ‘skewed’, in this case meaning we have many tiny farms of less than 10 acres that in some cases might be difficult to characterize as ‘farms’. In looking at the county profile for Boone County, for example, 31% of the farms had less than $2500 in sales and 16% were smaller than 10 acres. Some of these might be pastures supporting a few cattle, or vegetable gardening for farmers markets, legitimate and valuable activities to be sure but not characteristic of Iowa agriculture when considered as a whole.
The way USDA sorts the data on this makes it difficult to exactly quantify the economic share and land controlled by large operations. But I thought about this a little and decided to try something simple, that is, just take the average of the ranges shown in the table below (10 to 49 acres would be 29.5 acres, for example) to estimate the proportion of land and sales large farms were occupying in a few counties.
Since Adair County is first alphabetical, let’s look there first. Here is how USDA reports the data for 2022 (last year available):
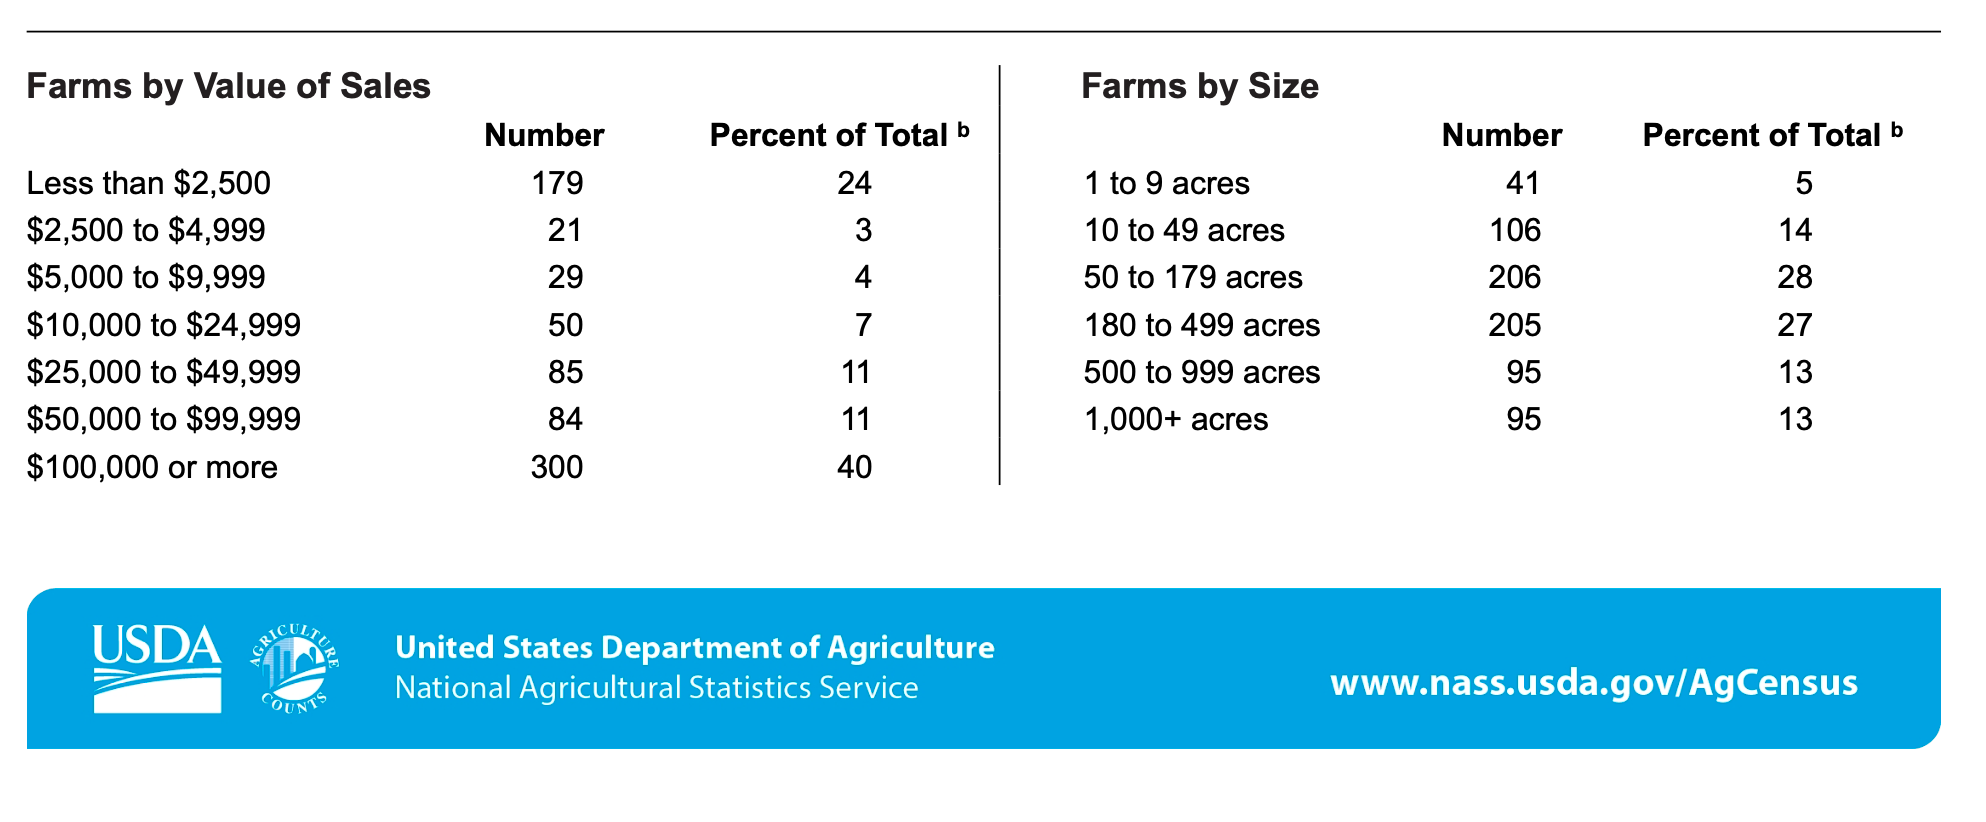
When I average the bin values shown in the tables above I can calculate that the 95 farms >1000 acres in Adair County (12.7% of the farms) control 51.8% of the farmland and that the average farm greater than 1000 acres is 1899 acres. In terms of farm income, farms with >$100,000 constitute 40% of the farms but account for a whopping 86% of farm sales in the county. Farms with more than $100,000 in sales have overall average sales of $218,000. Average net farm income for the county was $102,000 in 2022.

Let’s go to Sioux County in far Northwest Iowa, maybe the epicenter of the livestock industry. Farms greater than 1000 acres (6.2% of farms) control a smaller portion of all farmland (31.6%) when compared to Adair County. But if a farm had >$100,000 in farm sales in Sioux County, the average sales for that category would be $541,377, and these farms accounted for 97.6% of the county’s farm sales. USDA says 90% of the farms in the county are ‘family’ farms.
The average net farm income in Sioux County was $372,274 in 2022, up 71% from 2017. Average net farm income in Lyon County was even higher—$383k. Bear in mind the income for an average Iowan is in the $50k/year neighborhood.

I intend to go through all these county profiles for Iowa in the coming weeks.
Very interesting analyses, both on fecal inputs & the ‘family farm.’ We were discussing the latter yesterday — something both sides of political aisle pay homage to, whereas my feeling is it is a myth where corporate farming prevails, protected from regulation by the myth
Once again you have pulled back the curtain of the Ag industrial pollution complex. It’s hard to be old and see how long people and politicians have ignored the unsustainable trajectory of food, fiber, & fuel (ACK!) production.
My first non political job after Law School was as a consultant for the Iowa Department of Soil Conservation tasked with draft ing the State’s first 5 year Strategic Plan for soil conservation in 1979. BTW it was Gov. Braindead who first started weakening Iowa leadership in soil conservation by consolidating the single focus agency into the pro-production Ag Department. Note: that same reorganization combined the environmental and natural resources agencies where I was working, and in the musical chairs game of reallocating senior positions, I lost my Missouri/Mississippi Rivers position and got assigned to the legal shop. BTW soon I left to run the Iowa Nature Conservancy where I was able to help enact both the Groundwater Protection Act and the Resources Enhancement and Protection Act (REAP). I could go on, but this should be about You and current Iowa
Thank you for speaking/writing Truth to Power!!